Consumption comparison
How does DMU compare to other universities?
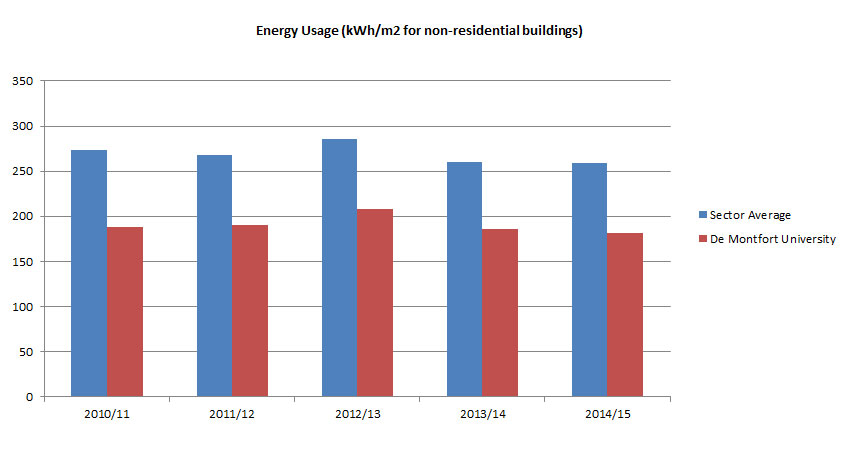
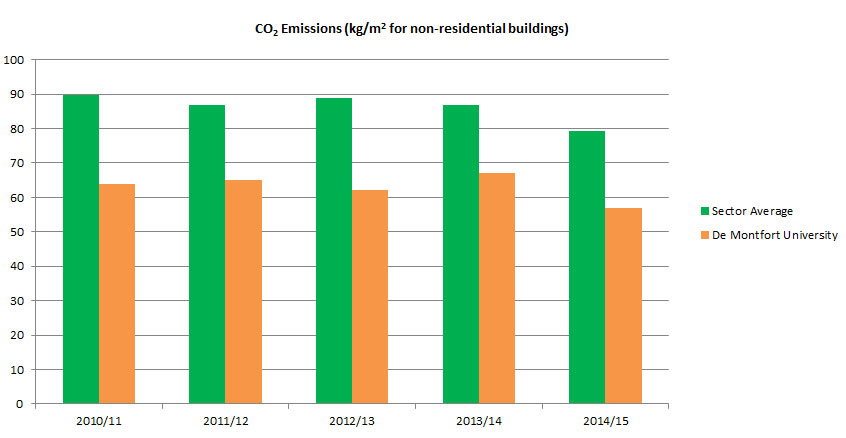
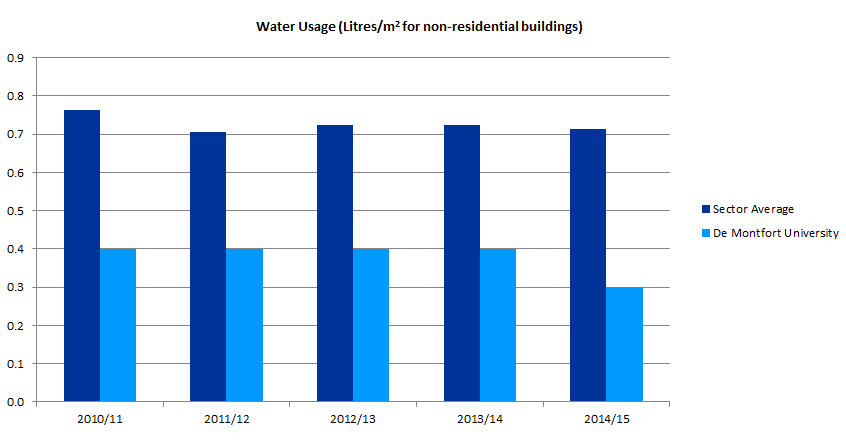
Estate management statistics are reported by higher education institutions each year and collated by the Higher Education Funding Council for England (HEFCE).
The charts below show data for energy consumption, CO2 emissions and water consumption, from 2008/09 to 2012/13. Each figure is shown per metre of square metre of floor area, to allow for comparisons between smaller and larger universities. Each of the three charts shows De Montfort University performing well when compared to the average for the higher education sector.