Carbon management
The university takes a comprehensive approach to measuring and reporting its carbon (greenhouse gas) emissions and works to reduce emissions not only through the management of its estate and operations but also through the engagement and education of its students and staff. The university has produced a Carbon Management Plan which sets out how DMU plans to reduce its carbon emissions.
The university has set itself demanding targets for reducing its carbon emissions. These targets include carbon emissions from energy use and DMU owned vehicles (known as scope 1 and 2 emissions), and emissions from waste, water, business travel, staff and student commute, international student travel, UK based student travel, and procurement (which are collectively known as scope 3 emissions).
In November 2019 the university recognised and acknowledged the Climate Emergency and agreed carbon reduction targets for the university of:
- achieving net zero carbon emissions from scope 1 and 2 sources by 2032
- achieving net zero carbon emissions from scope 3 emissions by 2045
Achieving net zero emissions means removing as many emissions as we produce. This not only includes reducing emissions but also how we manage resources and land use and includes issues such as carbon offsetting.
The net zero carbon targets build upon the University's interim carbon reduction targets: These are:-
- reduce scope 1 and 2 carbon emissions by 43% in 2020/21 based on 2005 levels
- reduce scope 3 carbon emissions by 14% in 2020/21 based on 2005 levels
As part of the university's acknowledgement of the Climate Emergency it has also committed to:-
- Intermediate carbon budgets from 2020 towards the 2032 and 2045 targets
- Divest from any investment in fossil fuel extraction by 2023
- Work with Leicester City Council and other partners to support local action on the climate emergency
- Engage staff and students on climate change issues through the Carbon Literacy project
- Establish cross-university working groups in relation to key areas e.g. energy, procurement, and travel
- Complete an analysis of climate-induced risks to core operations of DMU
- Establish a communication strategy and brand for DMU’s climate change and sustainable development initiatives
Progress against these commitments will be reported on a regular basis to senior management and through annual sustainability reports.
Our progress on reducing emissions
DMU has been using 2005/06 as the baseline year for calculating emissions reductions due to the availability of data for that period. In 2005/2006 the university had emissions of:-
- scope 1 and 2 emissions of 13,217 tCO2e (tonnes of carbon equivalent)
- scope 3 emissions of 43,832 tCO2e (tonnes of carbon equivalent)
Our progress for these emissions for 2019/2020 was:-
- scope 1 and 2 carbon emissions reduced by 58% compared to 2005/2006
- scope 3 carbon emissions are currently by 13% higher than the baseline year 2005/2006
Details of the trends in emissions over the past few years at DMU can be seen in graphs below.
Due to the various emission sources which make up the collective scope 3 emissions it is envisaged that the emissions from some sources will increase in the period to 2020. The contribution to the overall carbon footprint of the university from these sources is relatively small. Reductions in emissions from larger scope 3 emitting sources should compensate for these increases. As such, the overall scope 3 emissions are expected to reduce by 14% by 2020/2021.
Progress against these targets are reported annually. Details of our recent performance against these targets are set out below or can be viewed in the DMU annual sustainability reports.
The projects that will be implemented to reach the carbon reduction targets are contained within the university’s carbon management plan. These projects include implementing renewable energy technologies in DMU buildings, engaging with staff and students on behaviour change projects such as Green Impact and providing information to building users through frequent energy reports.
How can you get involved
There are many things that you can do to help reduce carbon emissions at DMU. Our website has some useful tips to help you save energy. If you are student at DMU you can take part in the Student Switch Off project and win prizes for saving energy in halls of residences. Student Switch Off is an energy saving competition between halls of residences. There are prizes to win and the hall that saves the most energy gets a free ice-cream party at the end of the year.Working together staff and students can help to reduce carbon emissions through DMU’s Green Impact project. Green Impact makes the university greener and at the same time helps students to gain new skills, develop their knowledge of environmental issues, gain experience of auditing and make new friends.
Our performance
DMU has been monitoring and reporting its greenhouse gas emissions from energy use for a number of years. The figure below shows the trend in greenhouse gas emissions since the baseline year of 2005/06. For the past four years there has been a downward trend in carbon emissions from scope 1 and 2 sources.
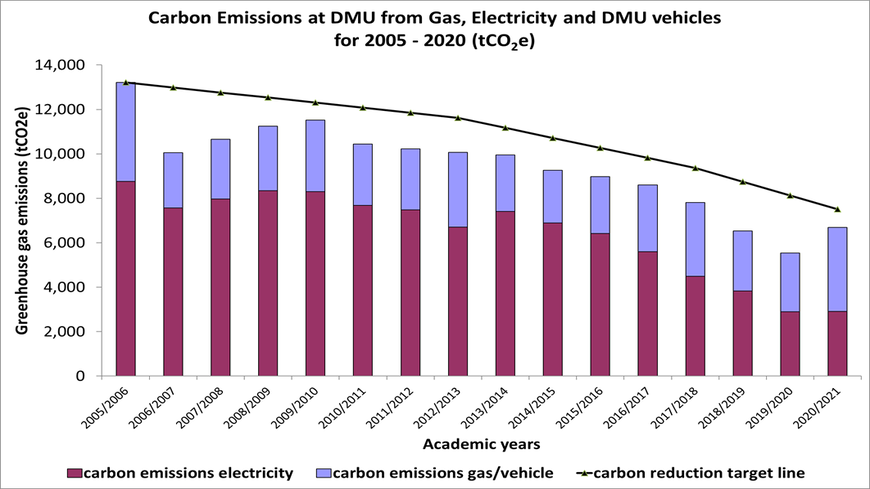
Graph description: The graph shows the emissions from electriity and gas/vehicles, relative to the carbon reduction target, measured in Greenhouse gas emissions (tCO2e). The tCO2e emissions are measured on the y axis, while the x axis represents the type of emission per academic year. The trend from the 2005/2006 academic year to the 2020/21 academic year is downward.
DMU has also been recording and reporting our emissions from scope 3 sources. The emissions sources are often overlooked but can account for the majority of an organisations carbon footprint. In the case of DMU the scope 3 sources account for approximately 75% of the university’s carbon footprint. The figure below shows how the different sources of carbon emissions make up the total carbon footprint for the baseline of 2005/2006.
The graph below shows the extent to which scope 3 emissions contribute to the total carbon footprint at DMU and how these emissions have been reducing since the baseline year of 2005/6.
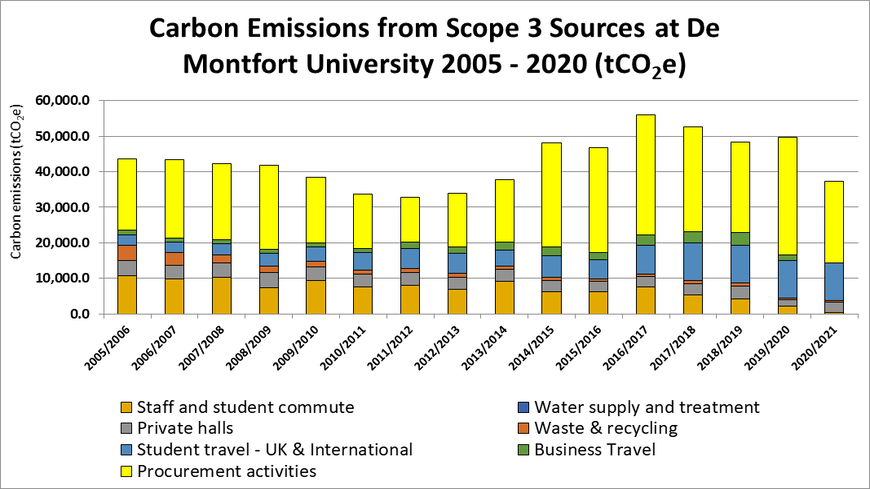
Graph description: The graph measures the carbon emissions (y axis) of different university activities, per academic year. The activities measured are staff and student commute, private halls, student travel – UK and international, procurement activities, water supply and treatment, waste and recycling, and business travel.
Information on DMU’s approach to sustainability can be found at www.dmu.ac.uk/sustainability.